Hello there! 🙂 I feel like I should open a decent bottle of champagne, as after all this time my first blog post is finally here 🙂
Thank you for being here, and I hope you will enjoy my content.
I was thinking, what is the best topic for the first blog post. If we start this journey together, what’s the better way if not having an introduction to Power BI, what is it exactly and where is it located within Microsoft ecosystem. I will also try to defend my stance on why do I think it’s a great tool to master. With no further ado, let’s start with the definition of Power BI.
What is Power BI?
There is probably a lot of definitions out there. I usually use the following:
Power BI is a set of tools, that allow to turn the raw data into valuable insights.
Of course, we can, and we should elaborate more on this definition. However, in my opinion it’s a good definition to start conversation about Power BI, because:
- It’s short and doesn’t overload your interlocutors with too many details, and you leave them hungry for more 🙂
- It covers the part explaining what it can do with the data
- Explicitly mentions, that this is not a single tool we are talking about
What can you do with your data in Power BI?
When it comes to working with data in Power BI, scenarios may vary, starting with importing a single Excel table, ending up with combining multiple data sources in one complex data model. Regardless, we can list generic steps that you will perform to achieve your end result. Power BI allows you to:
- Run ETL process using Power Query (Extract, Transform and Load data). Power Query allows you to perform complex operations on your data using just the User Interface. No coding is required, however, you may also use powerful M language for more advanced transformations.
- Build the (relational) tabular data model. Drag and drop interface allows you to graphically build your data model.
- Create dynamic calculations using DAX Language. All the calculations on row level could be done in Power Query or (even better) in the data source. On the other hand, we might want to create calculations, that will dynamically respond to User interacting with the report. DAX is the Data Analysis Expressions language, and allows us to create context specific calculations.
- Visualize the data. Power BI offers a set of standard charts, which you may use to tell the story using your data. There are basic charts available like Bar charts, Line charts, etc., as well as complex charts powered by AI. You may also reach out for additional graphs by leveraging your Python/R programming knowledge, or simply to go to AppSource and import a custom visual that answers to your needs.
- Share your report. Even the greatest report is useless if it doesn’t reach the audience 🙂 Power BI allows us to share the content in many ways. The main one involves Power BI Service, a cloud-based SaaS solution, where you can create dedicated workspaces, and share your reports from there.
- Build once and re-use. A published report is not the end of the road. Power BI report (rather the dataset behind that report) can be treated as a Semantic Layer of your data. You can build more than one report on single dataset, combine with other data using composite models, even make REST API calls against your data. You can endorse your datasets to highlight them for other users, and prevent your colleagues from building the same thing all over again.
Power BI Components
As it was mentioned, Power BI is not just a one tool. Let’s investigate what are building blocks for Power BI

- Power BI Desktop – Report authoring tool, allows to build ETL Process, Data Model, DAX Calculations and Visualize the data.
- Power BI Service – Cloud based SaaS solution, used to share the content with other users. But, there is more. With help of Power BI Service we can create Dashboards (combine multiple reports in one-pager), Dataflows, Datamarts, etc.
- Power BI Mobile – End-Users may download a mobile app to consume specially designed reports on their mobile phones.
- Power BI Report Server – A leaner version of Power BI Service, that can be installed locally (on-prem solution). If for any specific reason, enterprise data can’t be moved to cloud, companies may use Power BI Report Server and install it locally in their data centers. It’s often seen in banks, where data regulations are very strict.
- Power BI Report Builder – Additional tool that allows to build pixel-perfect reports, mainly for printing purposes. We can also include paginated reports as a visual in our Power BI reports.
- Power BI Embedded – Allows to embed your Power BI reports in web applications. Often used to deliver the content to 3rd party companies.
Where is Power BI placed within Microsoft ecosystem?
Here comes probably the most interesting part, as Power BI is a part of two large platforms delivered by Microsoft. Initially, Power BI was presented as one of the tools within Power Platform – Platform as a Service (PaaS) solution for business app developers. In time, Power BI was more and more integrated with solutions within Microsoft Azure, as a part of what Microsoft called an Intelligent Data Platform. Concept of having seamless experience while working with the data, having Data Ingestion and Storage (Data Lakes and Data warehouses) covered by Azure Services, Data governance with Microsoft Purview, and data presentation layer covered by Power BI. Timing wise, it couldn’t be more perfect, because today Microsoft announced a game changer within modern data platforms – Microsoft Fabric. Unified platform that aims to bring Data Engineers, Data Scientist, Data Analysts and Business Users in single workspace, to break the silos and work together on the same datasets. Let’s look at both platforms to see why Power BI is so special.
Power BI within Power Platform
Power Platform solves specific problem – being able to quickly respond to constantly changing business needs. Technology evolves with terrifying pace, and the same we can observe in ways companies run their business. Requirements may change from one day to another, and companies can’t afford to spend years to develop business applications. Here comes Power Platform – a rapid development environment for business applications. Main goal of Power Platform was to create a collaborative environment, where Citizen Developers (leveraging low-code solutions) may join forces with Pro-Developers to build business applications. Citizen Developers are closer to the business, and may react quickly in terms of building MVP, or sometimes even full solutions. If needed, they can ask Pro-Developers to continue the work and deliver enterprise level applications, but with delivery of MVP, at least some part of business needs is already covered.
This concept translates perfectly to the realm of Power BI. Citizen developers may be responsible for creating small reports for the needs of their Teams, or even be responsible for minor maintenance activities of large solutions, and Pro-Developers, usually coming from IT department, would be involved in large deployments, where complex architecture is required.

I promise to come back to Power Platform topic in future. Today, let’s focus only on the Power BI part. On one side, we have a bit of the inconsistency, as we have separate Administration Centers for Power Platform and Power BI. There is also a huge difference in architecture (concepts of Workspaces and Capacities in Power BI vs Environments with Power Platform), but this is again a topic for future discussion. Despite those differences, level of integration between these tools is unprecedented.
- Power Apps – You may embed a Power Report inside your application, and vice versa, you may embed Power App application within your Power BI Report. Imagine being able to interact with data source directly from Power BI Report level, to modify targets, populated missing data in project tracker, etc.
- Power Automate – Allows you to create automation flows that are capable of running a refresh of your datasets, making a REST API call against existing dataset to pull some information. On the other hand, you may also trigger automation flows from your Power BI report, by using dedicated Power Automate visual.
- Connectors – Power Platform makes it very easy to connect to your data sources. You don’t need to waste time to come up with lines of code needed to connect to your data. Instead you may focus only on what you would like to do with it.
- Dataverse – Out-of-the-box solution, that allows to integrate and store the data within relational data model. While it technically has nothing to do with Power BI, it is actually a very important data source for Power BI reports. Especially in companies that work with Dynamics 365.
For Power Pages and Virtual Agents we can talk about some integration with Power BI, but it’s not that relevant as for the mentioned components. For the remaining part: Power Fx and AI Builder, these are not related to Power BI specifically, so let’s leave them for now.
As you can see, we can achieve great business results with Power Platform, and Power BI plays very important role here.
Power BI within Microsoft Fabric
Microsoft Fabric is a very fresh topic, therefore, we will not spend too much time today to cover it. We will come back to this in future. For now, let’s just have a look at official materials delivered by Microsoft
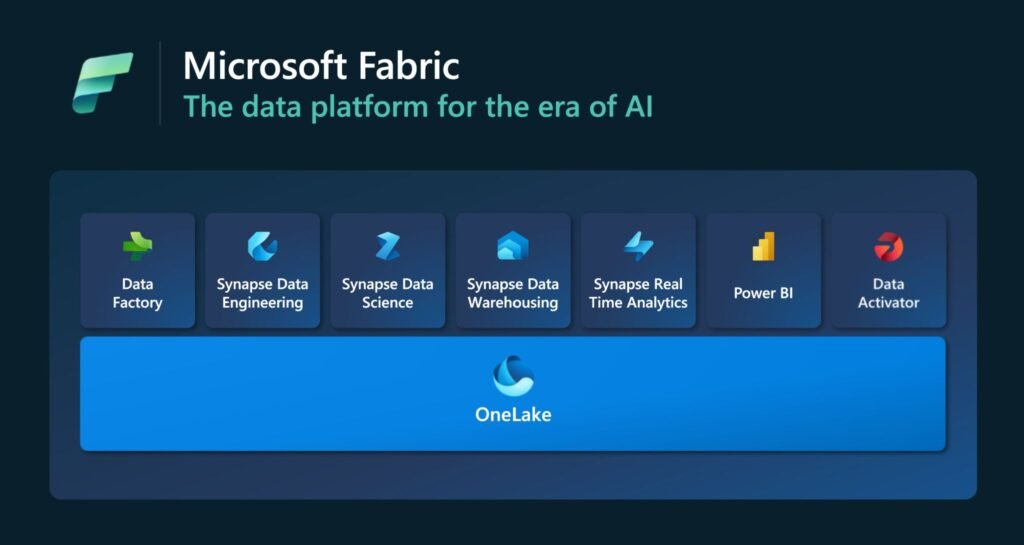
Microsoft Fabric brings all these tools to Power BI workloads. What does it mean? It means that resources responsible today for running Power BI artifacts in Premium Capacities, will also be responsible to run workloads for other services as well. This will simplify the cost management, help to utilize resources in more efficient manner, and (most importantly) will bring all different Data related personas into one collaboration space.
When we look at the list of the components, names are pretty much self-explanatory. The only item that maybe requires a bit more details is Data Activator. This is one of the features I am really excited about, as it allows to achieve a certain level of automation, when it comes to triggering an action based on specific data condition. I imagine this is more or less similar to Business Process Flow within Power Platform. It will allow us also notify people in case important data attributes are missing within of one the records, we can assume then that the tool will play important role in assuring proper data quality.
Another important concept here is OneLake, which is explained by Microsoft as a “OneDrive for your data”. That’s an interesting way of explaining it, but it’s in fact much grater. It’s not only a single storage for all the solutions we see in the picture. Microsoft did a lot when it comes to optimizing the storage, as data is stored in parquet files. One of the great features OneLake has to offer is being able to connect Power BI directly to your data, using Direct Lake (equivalent of Direct Query but for OneLake data). You might ask what’s so great about it, since we already have Direct Query, however, it is said that Direct Lake performance is on par with the Import Mode. If that happens to be the case – this is a game changer, especially for big data analytics, where we would probably exceed limits for Dataset size while using Import mode.
Conclusion
Power BI is a huge topic on its own. If you like to learn, you can be sure that Power BI will keep you entertained for a very long time. Therefore, if you are planning to build your career around Power BI, you may choose one of these paths:
- Power BI Developer – Probably good point to start, create as many reports as possible and learn from them as much as you can.
- Power BI Architect – master all the areas of Power BI, in order to support your company in building state of the art analytics solutions.
- Power Platform Developer – You might want to compromise in-depth Power BI learning for the sake of mastering the rest of Power Platform. You can be one stop shop to solve all your business problems 🙂
- Whichever path you take, you may expand your knowledge with Microsoft Fabric, and enter the world of Data Engineering, Data Governance, and more.
We for sure covered a lot today. Thank you for staying with me till the end of this article. I hope you find it useful, especially if you are new to the topic of Power BI. Working with Power BI is very rewarding, and I am positive, that if you decide to build your career around it, you won’t regret it 🙂


Great job!